
TL;DR
- It assembles public measurements of stablecoin supply, issuer sizes, transaction activity, holder proxies and payment costs, quoting each with its source, date, denominator and method, and it never adds or compares figures produced by different instruments as if they were one series. Coverage is global, with the reference dates stated per row in the table below; every figure was last checked on 23 September 2026, except the Federal Reserve and Chainalysis wording, rechecked on 24 September 2026, and the CoinMarketCap snapshot, read on 7 October 2026. Each figure is as of its source's date and changes after it; the figures are re-checked when the report is next reviewed, and the date of the last review is shown at the top of the page.
- Every headline figure in this report is listed once below with what it measures (market coverage, activity or a headcount proxy), its reference date, geography, method and denominator, and the report quotes nothing that does not appear in this table. Where two rows measure the same thing by different instruments, they are shown separately and are not netted against each other.
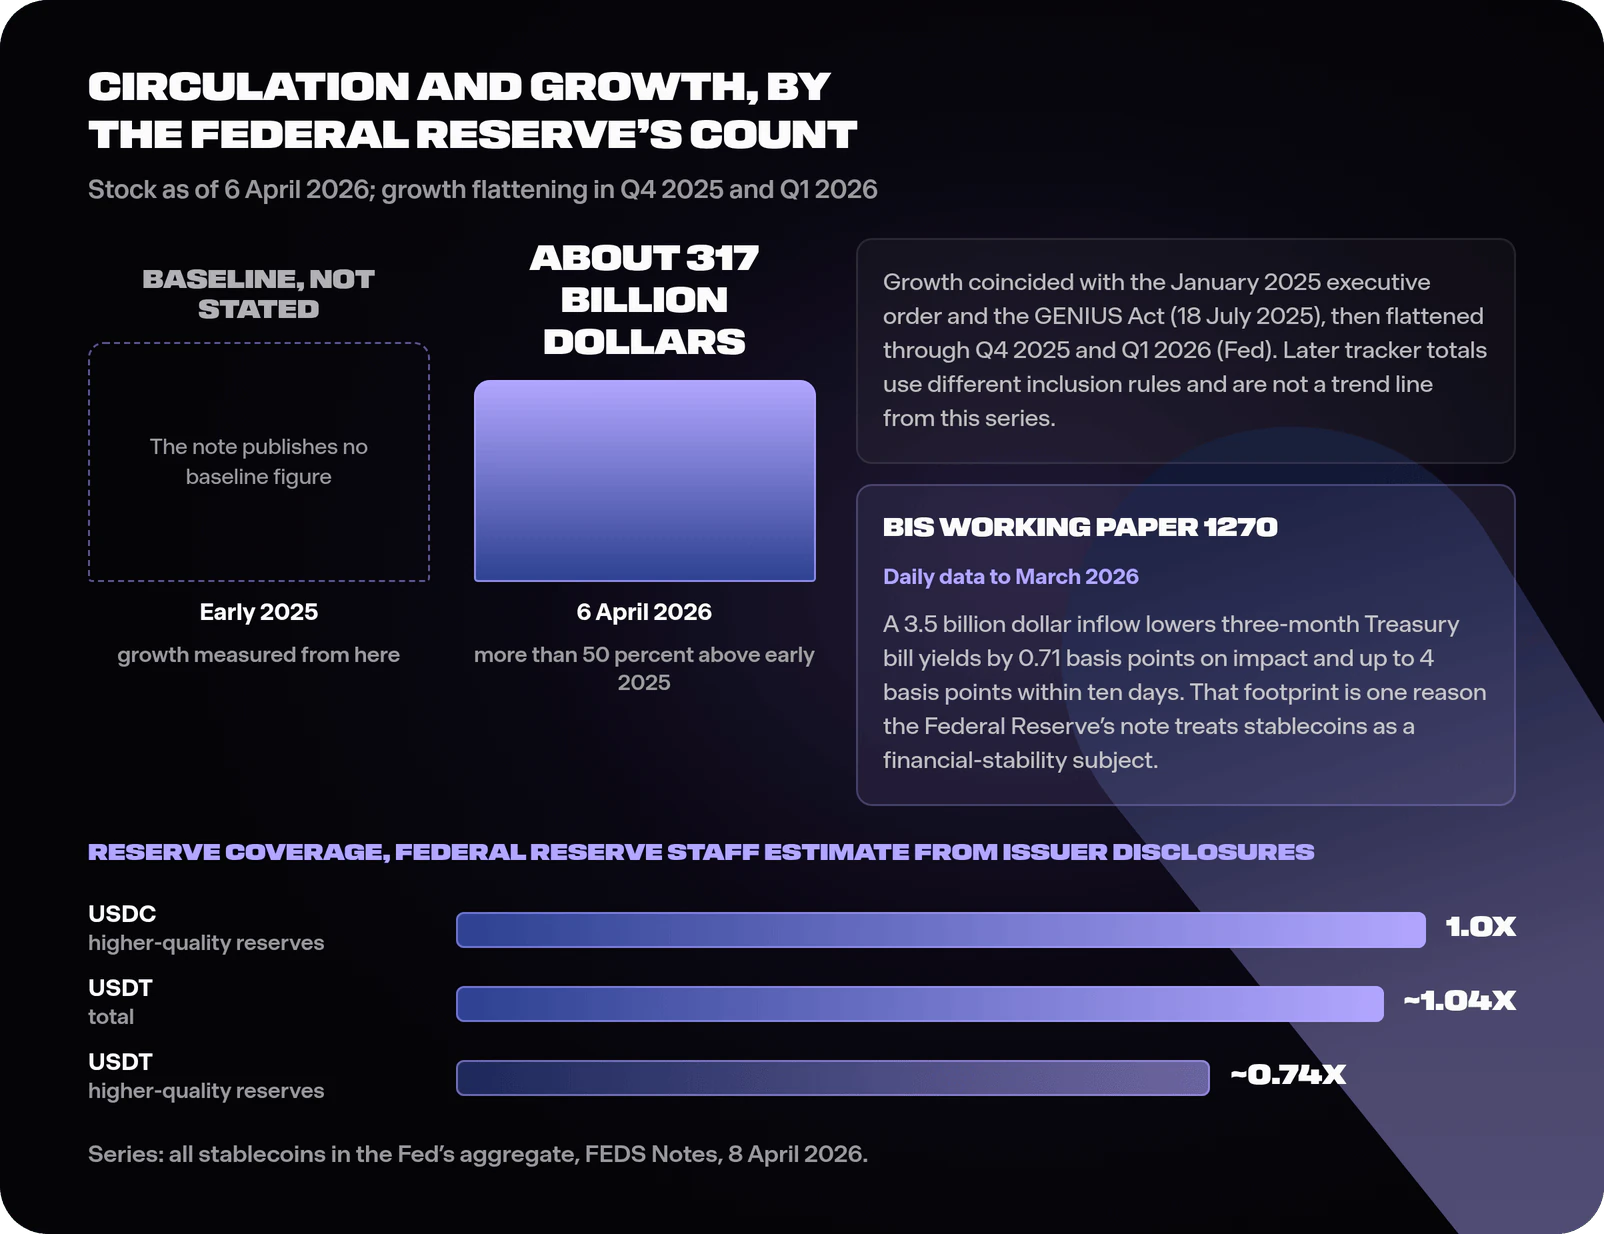
- About 317 billion dollars in aggregate market capitalisation on 6 April 2026 by the Federal Reserve's count, more than 50 percent above early 2025, with growth flattening in the fourth quarter of 2025 and the first quarter of 2026 (Federal Reserve, FEDS Notes, 8 April 2026). The note says that growth coincided with a January 2025 White House executive order and the enactment of the GENIUS Act on 18 July 2025.
- On a single CoinMarketCap snapshot read on 7 October 2026, USDT at about 184 billion dollars and USDC at about 74 billion together made up roughly 81 percent of a 318 billion dollar stablecoin list total, with USDS (about 9.9 billion), USDe (5.0), DAI (4.6), USD1 (4.4), USDG (3.2), PYUSD (2.9) and RLUSD (2.5) following (CoinMarketCap, read 7 October 2026). Concentration is the structural fact of the market and the structural risk in it; the order describes size on one date and says nothing about any token's quality, safety or suitability.
en una cuadra
The Stablecoin Adoption Report is a dated research assembly that quotes public measurements of stablecoin use, naming for each the instrument behind it, its reference date, its denominator and its limits.
Method: what this report measures, and how
Respuesta rápida
It assembles public measurements of stablecoin supply, issuer sizes, transaction activity, holder proxies and payment costs, quoting each with its source, date, denominator and method, and it never adds or compares figures produced by different instruments as if they were one series. Coverage is global, with the reference dates stated per row in the table below; every figure was last checked on 23 September 2026, except the Federal Reserve and Chainalysis wording, rechecked on 24 September 2026, and the CoinMarketCap snapshot, read on 7 October 2026. Each figure is as of its source's date and changes after it; the figures are re-checked when the report is next reviewed, and the date of the last review is shown at the top of the page.
Three source classes carry the report. Official research: the Federal Reserve's FEDS Note of 8 April 2026 on stablecoins in 2025, the Bank for International Settlements working paper on stablecoins and safe-asset prices, and the World Bank's Remittance Prices Worldwide series. Analytics firms with published methods: Chainalysis's annual adoption index for geography, and one market-capitalisation tracker, CoinMarketCap, for issuer sizes and a list total. CoinMarketCap's pages are live and change continuously, so the report uses a single snapshot, read at about 00:30 UTC on 7 October 2026, and every CoinMarketCap number on this page comes from that one reading. USDS does not appear in CoinMarketCap's stablecoin list on that reading, although its own CoinMarketCap page carries the Stablecoin tag, so its size is taken from that page at the same time and is not part of the list total. Regulatory and issuer record: the Federal Register's GENIUS Act proposed rule, ESMA's MiCA rulebook, and issuer or exchange statements, each labelled as a statement by that party.
Four cautions govern the reading. First, market coverage, activity and headcount are three separate measures: supply (circulation) counts tokens outstanding on a date, a stock; transfer volume counts value moved over a period, a flow; and headcount would count people, which neither of the other two does. Second, an address is a poor proxy for a person: address-based series overcount people who use many addresses and undercount people who hold through an exchange, where one address can stand for many customers. Third, on-chain volume depends on method: raw transfer totals include exchange internal movements, bot activity and looping that adjusted methods strip out, so this report quotes growth rates from a single instrument and does not set absolute volumes from different instruments side by side. Even an adjusted transfer total counts value moved between addresses, including movements between a single exchange's or holder's own addresses; economic payment activity, meaning transfers between distinct parties for goods, services, wages or remittances, is a narrower quantity that none of the sources in this report measures directly. Fourth, a regional index measures what its designers chose to measure: Chainalysis's index weights activity by purchasing power to surface grassroots use, covers all crypto activity, and ranks relative intensity rather than dollars moved.
The data table: what was measured, when, and by what method
Respuesta rápida
Every headline figure in this report is listed once below with what it measures (market coverage, activity or a headcount proxy), its reference date, geography, method and denominator, and the report quotes nothing that does not appear in this table. Where two rows measure the same thing by different instruments, they are shown separately and are not netted against each other.
| Measure | Type | Figure | Reference date or period | Geography | Method | Denominator or unit | Source |
|---|---|---|---|---|---|---|---|
| Aggregate stablecoin market capitalisation | Market coverage (stock) | About 317 billion dollars | 6 April 2026 | Global (on-chain) | Aggregate market capitalisation of stablecoins as compiled by the Federal Reserve from market data | US dollars; all stablecoins in the Fed's aggregate | Federal Reserve, FEDS Notes, 8 April 2026 |
| Growth in aggregate market capitalisation | Market coverage (change in stock) | More than 50 percent | Early 2025 to 6 April 2026 | Global (on-chain) | Same series as above; the note describes growth flattening in Q4 2025 and Q1 2026 | Percent of early-2025 stock (baseline value not published in the note) | Federal Reserve, FEDS Notes, 8 April 2026 |
| Tracker stablecoin list total | Market coverage (stock) | About 318 billion dollars (317,623,230,413 dollars shown) | Snapshot read at about 00:30 UTC on 7 October 2026 | Global (on-chain) | Total market capitalisation of the tokens CoinMarketCap lists as stablecoins, under the tracker's own inclusion rule, which the page does not define | US dollars; tracker's list definition | CoinMarketCap, Top Stablecoin Tokens by Market Capitalization, read 7 October 2026 |
| Issuer sizes: USDT, USDC, USDS, USDe, DAI, USD1, USDG, PYUSD, RLUSD | Market coverage (stock) | About 184, 74, 9.9, 5.0, 4.6, 4.4, 3.2, 2.9 and 2.5 billion dollars; USDT plus USDC roughly 81 percent of the list total | Same snapshot as the row above | Global (on-chain) | Tracker market capitalisation per token; USDS from its own CoinMarketCap page, outside the list total | US dollars per token; share computed against the 318 billion list total from the same snapshot only | CoinMarketCap, stablecoin list and USDS page, read 7 October 2026 |
| Stablecoin transaction volume on Ethereum | Activity (flow) | Up about 50 percent | From 18 July 2025 (GENIUS enactment) to the note's data cut in early April 2026 | Ethereum mainnet only | On-chain transfer volume for all stablecoins on Ethereum, as compiled by the Fed; all uses combined, including exchange and internal flows, so not a measure of payment activity | Percent change in value transferred | Federal Reserve, FEDS Notes, 8 April 2026 |
| Retail-sized wallets | Headcount proxy (addresses) | "Substantially increased" (no count published) | Calendar 2025 | On-chain, chains covered by the Fed's data | Addresses whose net weekly stablecoin holdings do not exceed 1,000 dollars | Addresses; one person can control many, and exchanges pool many customers | Federal Reserve, FEDS Notes, 8 April 2026 |
| Reserve coverage, USDC and USDT | Ratio | USDC 1.0x in higher-quality reserves; USDT about 1.04x total with about 0.74x in higher-quality reserves | As published in the note of 8 April 2026, from issuer disclosures available to its authors; later disclosures will differ | Issuer-level | Fed classification of Treasuries, Treasury-backed repo and bank deposits as higher-quality | Reserves per token in circulation | Federal Reserve, FEDS Notes, 8 April 2026 |
| Effect of stablecoin inflows on Treasury bill yields | Flow effect | A 3.5 billion dollar inflow lowers 3-month bill yields by 0.71 basis points on impact and up to 4 basis points within 10 days | Daily data, January 2021 to March 2026 | US Treasury market | Local projections with a granular instrumental variable at token-blockchain pair level | Basis points per two-standard-deviation inflow | BIS Working Paper 1270 (revised edition) |
| Grassroots adoption ranking | Index | India first, United States second, then Pakistan, Vietnam, Brazil | Twelve months to June 2025 | 151 countries | Four sub-indices (centralised service value, retail transfers under 10,000 dollars, DeFi, institutional transfers over 1 million dollars), weighted by purchasing-power-adjusted GDP per capita and population | Normalised 0 to 1 score; all crypto assets | Chainalysis, 2025 Global Crypto Adoption Index, 2 September 2025 |
| Asia-Pacific on-chain value received | Activity (flow) | Up 69 percent year on year, from about 1.4 trillion to about 2.36 trillion dollars | Twelve months to June 2025 versus the prior twelve months | Asia-Pacific | Chainalysis on-chain value received, all crypto assets | US dollars received | Chainalysis, 2025 Global Crypto Adoption Index, 2 September 2025 |
| USDT monthly transfer volume | Activity (flow) | Averaged roughly 703 billion dollars per month, peaking at about 1.01 trillion in June 2025 | June 2024 to June 2025 | Global (on-chain) | Chainalysis on-chain transfer volume, raw method as published; includes venue internal movements, so not a measure of payment activity | US dollars transferred per month | Chainalysis, 2025 Global Crypto Adoption Index, 2 September 2025 |
| Global average remittance cost, 200 dollars | Price | 6.36 percent | Q3 2025 | 367 corridors, 48 sending to 105 receiving countries | Mystery-shopping survey; total cost is transfer fee plus foreign exchange margin | Percent of a 200 dollar transfer | World Bank, Remittance Prices Worldwide, Issue 54, Q3 2025 |
| Remittance cost by channel and region | Price | Digital 4.59 percent; non-digital 7.30 percent; Sub-Saharan Africa 8.46 percent; 500 dollar transfer 4.08 percent | Q3 2025 | As above | As above | Percent of amount sent | World Bank, Remittance Prices Worldwide, Issue 54, Q3 2025 |
| Remittance cost target | Target | 3 percent by 2030 | Set by UN SDG 10.c and the G20 | Global | Policy target, not a measurement | Percent of amount sent | World Bank, Remittance Prices Worldwide, Issue 54, Q3 2025 |
Two rows in this table look like a pair and are not. The Federal Reserve's 317 billion dollars on 6 April 2026 and CoinMarketCap's 318 billion dollars on the 7 October 2026 snapshot come from different compilers with different inclusion rules; their closeness is evidence of neither a plateau nor a change, and this report draws no trend line between them. Issuer shares in the next section are computed only against the tracker total from the same snapshot. The activity rows also sit on a different scale from the supply rows: one token can be transferred many times in a month, so a monthly transfer volume can exceed the supply outstanding without any contradiction.
How large is the market, and how fast is it growing?
Respuesta rápida
About 317 billion dollars in aggregate market capitalisation on 6 April 2026 by the Federal Reserve's count, more than 50 percent above early 2025, with growth flattening in the fourth quarter of 2025 and the first quarter of 2026 (Federal Reserve, FEDS Notes, 8 April 2026). The note says that growth coincided with a January 2025 White House executive order and the enactment of the GENIUS Act on 18 July 2025.
The Federal Reserve's note is the report's anchor for the supply figure because it is an official publication that states its figures with dates and describes what they cover. The 317 billion dollar figure is aggregate market capitalisation of stablecoins as of 6 April 2026; the growth of more than 50 percent is measured from early 2025; and the note itself describes the pace flattening through the final quarter of 2025 and the first of 2026 (Federal Reserve, FEDS Notes, 8 April 2026). The note's activity finding, transfer volumes on Ethereum up about 50 percent since GENIUS enactment, is a separate series from the stock and is discussed in the uses section; the two can move differently, and a plateau in circulation alongside rising transfers would be consistent with the same tokens changing hands more often. The later CoinMarketCap snapshot in the table uses a different inclusion rule and does not extend this series.
For scale, the BIS working paper on stablecoins and safe-asset prices finds that dollar-backed stablecoin inflows measurably lower short-term Treasury bill yields: a 3.5 billion dollar inflow, about a two-standard-deviation move in the daily data from January 2021 to March 2026, lowers three-month bill yields by 0.71 basis points on impact and by up to 4 basis points within ten days, with limited spillover to longer maturities and larger effects under Treasury market stress (BIS Working Paper 1270, revised edition). That footprint in a core funding market is one reason the Federal Reserve's note treats stablecoins as a financial-stability subject. The reserve-quality figures quoted in what a stablecoin is, USDC at 1.0x in higher-quality reserves and USDT at about 1.04x total with about 0.74x in higher-quality reserves, come from the Federal Reserve's classification of issuer disclosures as published on 8 April 2026, and later disclosures will differ (Federal Reserve, FEDS Notes, 8 April 2026). What counts as backing for a given token, and who can redeem it directly, is covered in the comparison of the biggest stablecoins and is not repeated here.
Who issues the market, and how concentrated is it?
Respuesta rápida
On a single CoinMarketCap snapshot read on 7 October 2026, USDT at about 184 billion dollars and USDC at about 74 billion together made up roughly 81 percent of a 318 billion dollar stablecoin list total, with USDS (about 9.9 billion), USDe (5.0), DAI (4.6), USD1 (4.4), USDG (3.2), PYUSD (2.9) and RLUSD (2.5) following (CoinMarketCap, read 7 October 2026). Concentration is the structural fact of the market and the structural risk in it; the order describes size on one date and says nothing about any token's quality, safety or suitability.
The comparison of the biggest stablecoins sets the instruments side by side on backing, redemption eligibility, legal entity and audit or attestation status; this report records only the shape. All issuer figures in this section come from one tracker snapshot so that the shares add up. The 81 percent is a share of the list as the tracker defines it, which the page does not spell out; USDS, outside the list on that reading, is not in the denominator. This report computes no share of the Federal Reserve's April figure, because dividing an October numerator by an April denominator produces a number that describes no date. The ranking that follows is descriptive: a larger market capitalisation means more tokens outstanding on the snapshot date, and it is not evidence of stronger reserves, better redemption terms or lower risk, which the comparison guide examines token by token.
On the same snapshot USDT was the largest token in the tracker's list by market capitalisation, and Chainalysis's 2025 report describes USDT and USDC as tokens that "consistently dwarf other stablecoins in scale" (Chainalysis, 2 September 2025). Behind them the field changed in 2025 and 2026. Binance described DAI's move to USDS as a "token swap and rebranding" when it announced on 20 March 2026 that it would convert custodied DAI to USDS at one to one and remove DAI spot pairs from 7 April 2026; that is an exchange statement about DAI held on its own platform (Binance announcement, 20 March 2026). USDe, issued by what Ethena calls "a synthetic dollar protocol" (Ethena documentation) and whose design is covered in stablecoin stability and failure modes, was fourth on the snapshot. On the same snapshot, four other dollar tokens, USD1, USDG, PYUSD and RLUSD, each stood between about 2.5 and 4.4 billion dollars.
Concentration has two edges. When two issuers account for most of the list, the condition of their reserves matters to the whole market. Two regimes set reserve and redemption rules for issuers. In the United States, the GENIUS Act (Public Law 119-27, enacted 18 July 2025) applies to payment stablecoin issuers from the earlier of 18 January 2027 or 120 days after final implementing regulations, and the Treasury's proposed rules were published in the Federal Register on 18 August 2026. In the EU, the Markets in Crypto-Assets Regulation (Regulation (EU) 2023/1114) has applied its titles on e-money tokens (Title IV) and asset-referenced tokens (Title III) to their issuers since 30 June 2024. Both are covered in how stablecoins are regulated around the world. The March 2023 USDC episode shows what happens when part of a large issuer's reserves becomes temporarily inaccessible: Circle disclosed that 3.3 billion dollars of USDC reserves, about 8 percent of the total, were held at Silicon Valley Bank when that bank failed, and Circle's release reports that the depeg closed once the deposits were confirmed available on 13 March 2023 (Circle press release, 12 to 13 March 2023). The failure-modes guide covers the episode in detail. Its relevance here is that an event affecting a large issuer's reserves touches a large share of the category at once.
What are stablecoins used for, and how is that changing?
Respuesta rápida
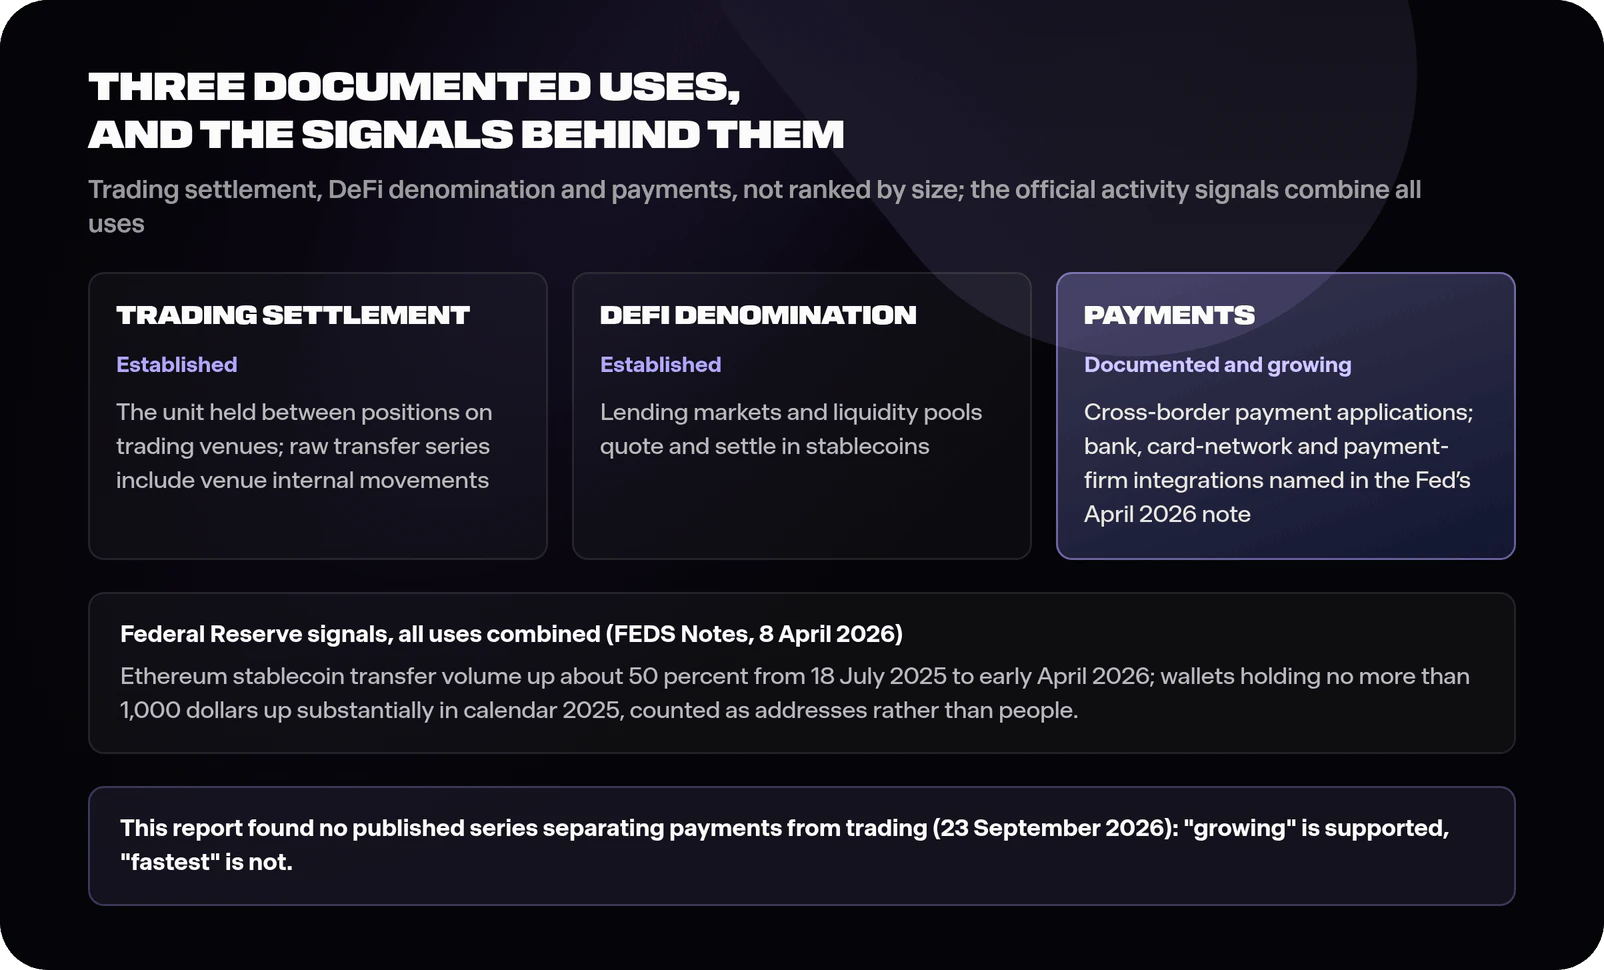
Documented uses include trading settlement, DeFi denomination and payments, and the official activity signals, Ethereum transfer volume up about 50 percent since 18 July 2025 and small-balance addresses rising through 2025, combine all uses (Federal Reserve, FEDS Notes, 8 April 2026). The Federal Reserve's note does not rank the uses by value, and as of 23 September 2026 this report had found no official or published series that separates payments from trading on a comparable basis, so it describes payments as a documented and growing use and does not call it the fastest-growing one.
On trading venues, the two largest tokens on the snapshot serve as the unit held between positions. Chainalysis's raw transfer series gives a sense of the scale of activity: USDT averaged roughly 703 billion dollars of on-chain transfer volume a month between June 2024 and June 2025, peaking at about 1.01 trillion in June 2025 (Chainalysis, 2025 Global Crypto Adoption Index, 2 September 2025). That is a raw activity figure that includes venue internal movements and automated activity, and it is quoted here for scale only; it is not a measure of economic payment activity, and because the same token can move many times, it cannot be compared with the supply figures above. DeFi is the other established use: lending markets and liquidity pools, covered in what DeFi is and DeFi lending and liquidations, quote and settle in stablecoins.
Payments are where the change is visible in institutional behaviour. The Federal Reserve's note records cross-border payment applications growing, naming Zelle's initiative to carry stablecoin transfers across member banks, Lead Bank's accounts for emerging-market users converting dollars to USDT or USDC for cross-border sends, a MetaMask and Mastercard card partnership and Interactive Brokers' USDC funding, and it finds that wallets whose net weekly holdings do not exceed 1,000 dollars increased substantially in 2025, which it reads as broader adoption by retail investors (Federal Reserve, FEDS Notes, 8 April 2026). Among the sources in this report, that retail-wallet series comes closest to a headcount signal. It still counts addresses, and one person can control many of them.
Why this report does not say payments are the fastest-growing use
The claim needs a payments-only series and a comparable trading or DeFi series over the same period from the same instrument. The Ethereum volume growth of about 50 percent is an all-use figure; the retail-wallet increase is a holdings figure with no use attached; and the payment integrations the note lists are events without a measured volume. Analytics firms publish adjusted-volume methods that strip out venue internal movements and bots, and they classify use in different ways, so their outputs cannot be joined into one payments series. Until a published method separates payments from trading on a stated basis, the supportable statement is that payments are growing, and that is what this report says.
Where in the world is adoption strongest, and why?
Respuesta rápida
By Chainalysis's 2025 index of grassroots crypto activity, weighted by purchasing power and covering the twelve months to June 2025, India leads, the United States is second, then Pakistan, Vietnam and Brazil, and Chainalysis reports the Asia-Pacific region's on-chain value received up 69 percent year on year, the fastest regional growth in its data (Chainalysis, 2 September 2025). The index measures all crypto activity; it is the closest published country ranking this report found, and it is not stablecoin-specific.
The index combines four sub-indices, on-chain value at centralised services, retail transfers under 10,000 dollars, DeFi activity and institutional transfers above 1 million dollars, weights them by purchasing-power-adjusted GDP per capita and population, and normalises the result to a score between 0 and 1 across 151 countries (Chainalysis, 2025 Global Crypto Adoption Index, 2 September 2025). The weighting lifts populous and lower-income economies by design. The Asia-Pacific figure, value received rising from about 1.4 trillion to about 2.36 trillion dollars over the twelve months to June 2025, is an activity measure for all crypto assets in the region.
The report's caveat is the method's. An activity index ranks relative grassroots intensity adjusted for income, so it answers "where is use most widespread relative to what people earn". The question "where do the most dollars move" needs unweighted volume, which the index is not designed to report. The index also counts all crypto assets; as of 23 September 2026 this report had found no official stablecoin-only country ranking on a published method, and it does not infer one.
How do stablecoin payment costs compare, in numbers?
Respuesta rápida
The World Bank's Remittance Prices Worldwide series put the global average cost of sending 200 dollars at 6.36 percent in the third quarter of 2025, defined as transfer fee plus foreign exchange margin, against a UN and G20 target of 3 percent by 2030 (World Bank, RPW Issue 54, Q3 2025). A stablecoin transfer's network fee can be cents, and it is one component of an end-to-end cost for which this report had found no official series as of 23 September 2026.
The remittance arithmetic starts with a like-for-like definition. The World Bank surveys 367 corridors from 48 sending to 105 receiving countries by mystery shopping, and its total cost is the transfer fee plus the exchange-rate margin the provider applies; at 6.36 percent, sending 200 dollars costs about 12.70 dollars, and the average was 4.59 percent for digital services against 7.30 percent for non-digital ones, 8.46 percent for transfers into Sub-Saharan Africa, and 4.08 percent for a 500 dollar transfer (World Bank, RPW Issue 54, Q3 2025). Those are the benchmark figures for any comparison with a stablecoin route, and they already include the exchange-rate margin.
A stablecoin route has at least four cost components, and the network fee is one of them. First, the on-ramp: buying the token for the sender's local currency, at a spread and often a platform fee. Second, the on-chain transfer: it can cost cents on layer 2 and high-throughput networks and more on congested ones, as explained in gas and network fees, and settles in minutes, as described in how crypto transactions get confirmed. Third, the off-ramp: converting the token to the recipient's local currency, at a spread that varies by corridor and provider. Fourth, compliance: identity checks and, where a jurisdiction's rules require them, travel-rule data and reporting on both ramps, covered in how stablecoins are regulated around the world. The Federal Reserve's observation that cross-border payment applications are growing, with named bank and payment-firm integrations, is the institutional side of this comparison (Federal Reserve, FEDS Notes, 8 April 2026); it does not measure the end-to-end cost.
The recipient's local currency leg also reintroduces the exchange-rate exposure the stablecoin removed for the crossing. Any comparison is therefore corridor-specific: on the network leg alone, a fee of cents is a small fraction of the World Bank average; end to end, the total depends on the ramps at both ends, which can leave a stablecoin route cheaper or dearer than a conventional transfer in a given corridor, and a claim that stablecoins cut a given corridor's cost needs an end-to-end measurement on the World Bank's definition, which this report has not found in an official or methodologically published series.
What does this edition not know?
Respuesta rápida
How many people hold stablecoins, what share of transfer value is payments rather than trading by a stated method, what a stablecoin remittance costs end to end on the World Bank's definition, and how much emerging-market activity is savings rather than spending. These are the measurement gaps future editions will track as official and analytics methods mature.
The headcount gap comes first. Address counts overstate people who use many addresses and understate exchange customers; the Federal Reserve's retail-wallet series counts addresses with net weekly holdings of no more than 1,000 dollars (Federal Reserve, FEDS Notes, 8 April 2026); survey instruments, like the Federal Reserve household survey used in the state of crypto self-custody report, ask about crypto broadly rather than stablecoins specifically; and this report found no authority that counts stablecoin holders as such. The use-split gap follows from the volume-method problem: raw and adjusted methods produce different levels, and the payments share of the total is an estimate that varies by instrument. The remittance gap is definitional: no series this report has found measures a stablecoin corridor's fee plus exchange-rate margin at both ramps on the World Bank's basis. And the emerging-market question, whether stablecoins there are held as dollar savings or spent as a payment rail, is answered anecdotally by regional reports and not yet by a consistent measurement. Each gap is recorded here so that the next edition can report which closed.
Frequently asked questions
How many people use stablecoins?
No source in this report counts them. The Federal Reserve's retail-wallet series shows addresses holding no more than 1,000 dollars rising substantially in 2025, but one person can control many addresses and an exchange can hold many customers' tokens at a few addresses. Household surveys ask about crypto in general. The report names the gap and does not fill it with a vendor's estimate.
Why do different sources give different totals for the stablecoin market?
Each compiler decides which tokens count and when it reads them. The Federal Reserve's about 317 billion dollars (6 April 2026) and CoinMarketCap's about 318 billion (snapshot read on 7 October 2026, under the tracker's own list definition) differ in both date and inclusion rule, so neither the gap nor the closeness between them measures a change. Totals of this kind measure supply. Transfer volume measures activity and can exceed supply over a month because the same token can move repeatedly.
Is stablecoin growth mostly crypto trading?
The public series in this report cannot say, because each one mixes uses. One way to see why is to set the stock beside the flow. The Federal Reserve describes supply growth flattening in the fourth quarter of 2025 and the first quarter of 2026, while Ethereum transfer volume rose about 50 percent from 18 July 2025 to early April 2026 (Federal Reserve, FEDS Notes, 8 April 2026). That pattern is consistent with tokens changing hands more often, and the volume series counts a trading bot's transfer and a remittance the same way. Chainalysis's USDT volume of roughly 703 billion dollars a month is a raw figure that includes venue internal movements (Chainalysis, 2 September 2025). An answer would need a payments-classified volume series with a published method.
Which country uses stablecoins most?
This report found no official stablecoin-only country ranking. The nearest published measure, Chainalysis's 2025 index, covers all crypto activity weighted by purchasing power for the twelve months to June 2025 and ranks India first and the United States second. A ranking by unweighted dollar volume would answer a different question.
Are stablecoins cheaper than bank transfers for remittances?
It depends on the corridor and the ramps, and a worked illustration shows how. On the World Bank's definition, sending 200 dollars at the Q3 2025 global average of 6.36 percent costs about 12.70 dollars, fee and exchange-rate margin included (World Bank, RPW Issue 54, Q3 2025). As a hypothetical, a stablecoin route whose on-ramp and off-ramp each cost 1 percent would come to about 4 dollars plus the network fee; one whose ramps cost 3.5 percent each would come to about 14 dollars, above the average. The figures in that example are illustrative and describe no named provider. No official series measured the end-to-end cost as of 23 September 2026.
Will this report be updated?
Every figure here is as of its source's date and will change. When the report is next reviewed, each figure is re-verified against its source, the CoinMarketCap snapshot and every number that depends on it are refreshed together, and the measurement gaps are re-examined as the GENIUS Act rulemaking (Treasury proposed rules published 18 August 2026), supervision under MiCA and other regimes change how stablecoins are issued and used. The last review date is stated at the top of the page; no fixed schedule is promised.
Sources and further reading
Every figure in this edition was checked against the source listed on 23 September 2026; the Federal Reserve and Chainalysis wording was rechecked on 24 September 2026, and the CoinMarketCap snapshot was read on 7 October 2026. Sources are listed with the date of the source itself; the data table above gives the reference date of each figure.
- Stablecoins in 2025: Developments and Financial Stability Implications (FEDS Notes). Board of Governors of the Federal Reserve System, 8 April 2026. https://www.federalreserve.gov/econres/notes/feds-notes/stablecoins-in-2025-developments-and-financial-stability-implications-20260408.html (accessed 24 September 2026)
- Primary and Secondary Markets for Stablecoins (FEDS Notes). Board of Governors of the Federal Reserve System, 23 February 2024. https://www.federalreserve.gov/econres/notes/feds-notes/primary-and-secondary-markets-for-stablecoins-20240223.html (accessed 23 September 2026)
- Stablecoins and safe asset prices, BIS Working Paper 1270 (Ahmed and Aldasoro). Bank for International Settlements, 28 May 2025, revised edition with data to March 2026. https://www.bis.org/publ/work1270.pdf (accessed 23 September 2026)
- The 2025 Global Crypto Adoption Index. Chainalysis, 2 September 2025. https://www.chainalysis.com/blog/2025-global-crypto-adoption-index/ (accessed 24 September 2026)
- Remittance Prices Worldwide, Issue 54, Q3 2025 (main report and annex). World Bank, September 2025. https://remittanceprices.worldbank.org/sites/default/files/2026-04/RPW_main_report_and_annex_Q325.pdf (accessed 23 September 2026)
- Remittance Prices Worldwide (database and methodology). World Bank, ongoing. https://remittanceprices.worldbank.org/ (accessed 23 September 2026)
- GENIUS Act Regulations on Payment Stablecoin Issuance, Offer, and Sale (notice of proposed rulemaking). Department of the Treasury, Federal Register, 18 August 2026. https://www.federalregister.gov/documents/2026/08/18/2026-16796/genius-act-regulations-on-payment-stablecoin-issuance-offer-and-sale (accessed 23 September 2026)
- Guiding and Establishing National Innovation for U.S. Stablecoins Act, Public Law 119-27. US Government Publishing Office, 18 July 2025. https://www.govinfo.gov/content/pkg/PLAW-119publ27/html/PLAW-119publ27.htm (accessed 23 September 2026)
- Top Stablecoin Tokens by Market Capitalization (live tracker page; issuer sizes and list total taken from one snapshot read at about 00:30 UTC on 7 October 2026, showing a market cap of 317,623,230,413 dollars; values on the live page will differ). CoinMarketCap. https://coinmarketcap.com/view/stablecoin/ (accessed 7 October 2026)
- USDS price, market cap and supply (live token page; read at the same time, market cap 9.88 billion dollars, tagged Stablecoin). CoinMarketCap. https://coinmarketcap.com/currencies/usds/ (accessed 7 October 2026)
- Binance Will Support the Dai (DAI) Token Swap and Rebranding to USDS (USDS) (exchange announcement). Binance, 20 March 2026. https://www.binance.com/en/support/announcement/detail/df2ce9c43b1d406ca2c4b14e4e34610a (accessed 23 September 2026)
- $3.3 Billion of USDC Reserve Risk Removed, Dollar De-peg Closes (issuer press release). Circle, 12 to 13 March 2023. https://www.circle.com/pressroom/3-3-billion-of-usdc-reserve-risk-removed-dollar-de-peg-closes (accessed 23 September 2026)
- Ethena documentation (overview; issuer's own description). Ethena, ongoing. https://docs.ethena.fi/ (accessed 24 September 2026)
- Markets in Crypto-Assets Regulation (EU) 2023/1114, interactive single rulebook. ESMA, ongoing. https://www.esma.europa.eu/publications-and-data/interactive-single-rulebook/mica (accessed 23 September 2026)
To cite this report: Bron Academy Editorial, The Stablecoin Adoption Report, last reviewed 6 October 2026, bron.org/academy.
Prueba rápida: ¿se mantuvo?
Llegaron algunas preguntas para comprobar los fundamentos. Siguen respuestas con explicaciones y nadie lo califica excepto su futuro portafolio.


¡Has completado un cuestionario sobre “The Stablecoin Adoption Report”! Comparte tu logro en las redes sociales.
 ¿Fue esto útil?